 1
 2
 3
 4
 5
 6
 7
 8
 9
10
11
12
13
14
15
16
17
18
19
20
21
22
23
24
25
26
27
28
29
30
31
32
33
34
35
36
37
38
39
40
41
42
43
44
45
46
47
48
49
50
51
52
53
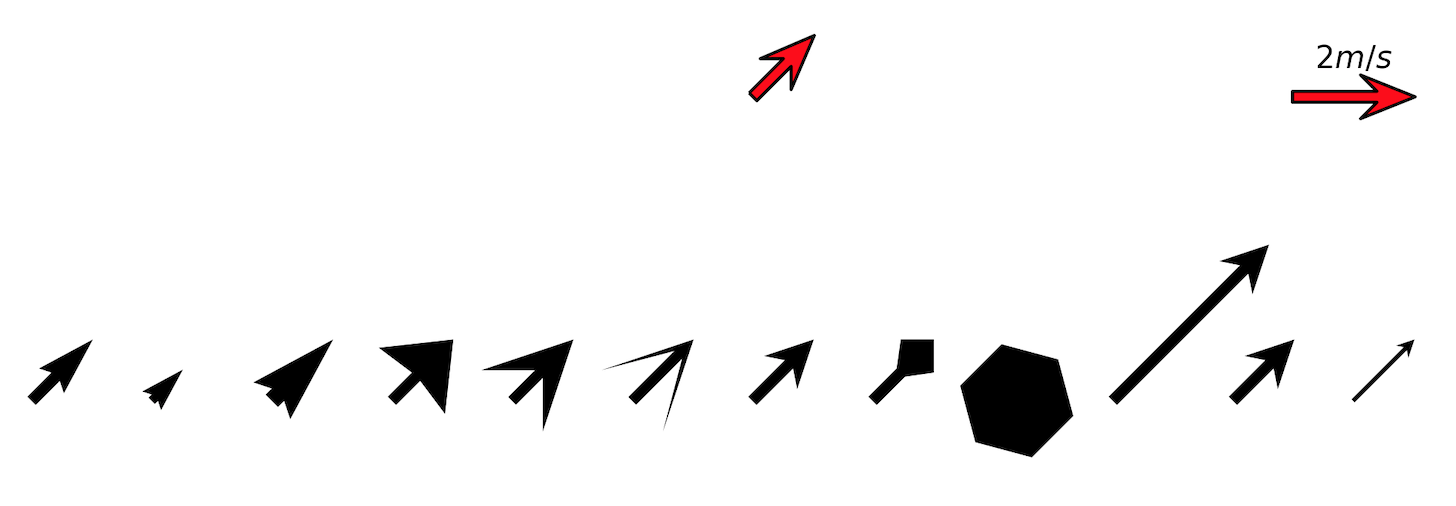
|
import matplotlib.pyplot as plt

fig, ax = plt.subplots(figsize=(9, 9))

# 默认选项
q1 = ax.quiver(0, 0, 1, 1)

# 修改 scale 放缩矢量符号,scale 值越大,矢量越小,相反越大
q2 = ax.quiver(0.1, 0, 1, 1, scale=50)

# 修改 width, 默认为图形宽度的 0.005 倍,一般不需要改动
q3 = ax.quiver(0.2, 0, 1, 1, width=0.02)

# headwidth 矢量符号箭头的宽度
q4 = ax.quiver(0.3, 0, 1, 1, headwidth=8)

# headlength 矢量符号箭头的长度,从尖部到尾部
q5 = ax.quiver(0.4, 0, 1, 1, headwidth=8, headlength=8)

# headaxislength 矢量符号箭头的尖部到矢量符号轴和箭头的交接处的长度
q6 = ax.quiver(0.5, 0, 1, 1, headwidth=8, headlength=8, headaxislength=2)

# 保持 headwidth 和 headlength相同,headaxislength 稍小于 headlength,如果 headaxislength = headlength,矢量箭头将为三角形
q7 = ax.quiver(0.6, 0, 1, 1, headwidth=4, headlength=4, headaxislength=3)

# headlength 小于 headaxislength,矢量箭头变成了四边形
q8 = ax.quiver(0.7, 0, 1, 1, headwidth=4, headlength=2, headaxislength=4)

# minlength 表示矢量长度的阈值,当矢量长度小于此值时,矢量将替换为正六边形
q9 = ax.quiver(0.82, 0, 1, 1, headwidth=4, headlength=4, headaxislength=3, minlength=10)

# 矢量的长度与scale密切相关,更改 scale 可以调整矢量的长度
q10 = ax.quiver(0.9, 0, 1, 1, headwidth=4, headlength=4, headaxislength=3, minlength=10, scale=10)

# minshaft 表示对长度较小的矢量进行放缩,如果长度很小时,此值小于1,那么小箭头将看起来很奇怪
# 一般不需要修改此值
q11 = ax.quiver(1, 0, 1, 1, headwidth=4, headlength=4, headaxislength=3, minshaft=0.5)
q12 = ax.quiver(1.1, 0, 1, 1, headwidth=4, headlength=4, headaxislength=3, minshaft=5)

# 一般情况下默认 scale 即可,可根据需要调整 width, 矢量箭头的相关参数即可
# facecolor 表示箭头表面颜色,linewidth 和 edgecolro 控制矢量轮廓属性
q0 = ax.quiver(0.6, 0.2, 1, 1, width=0.007,
               headwidth=4, headlength=5, headaxislength=3.5
               facecolor='red', linewidth=1, edgecolor='k')

# 添加quiver刻度标签
# 一般情况下建议不要改动 coordinates 参数值,除非需要固定位置,固定位置时不建议使用 data 坐标,
# 可使用 axes 或 figure 坐标
qk = ax.quiverkey(q0, 1.1, 0.2, 2, '$2 m/s$', coordinates='data')

_ = ax.set_xlim([-0.1, 1.2])
_ = ax.set_ylim([-0.5, 0.5])
ax.set_axis_off()
|