 1
 2
 3
 4
 5
 6
 7
 8
 9
10
11
12
13
14
15
16
17
18
19
20
21
22
23
24
25
26
27
28
29
30
31
32
33
34
35
36
37
38
39
40
41
42
43
44
45
46
|
from datetime import datetime
import numpy as np
import pandas as pd
from matplotlib import cm, colors
import matplotlib.pyplot as plt
import seaborn as sns
sns.set_context('talk', font_scale=1.3) # 调整图的配置
## 自定义 colormap
colors_pm = ['#009966', '#FFDE33', '#FF9A32', '#CC0033', '#660099', '#7D0023']
levels = [0, 35, 75, 115, 150, 250, 350]
cmap_pm = colors.ListedColormap(colors_pm)
norm = colors.BoundaryNorm(levels, cmap_pm.N)
## 创建 DataFrame
date_range = pd.date_range(datetime(2015, 1, 1), datetime(2015, 12 ,31), freq='1d')
data = pd.DataFrame(np.random.random(365) * 300, index=date_range, columns=['pm2.5'])
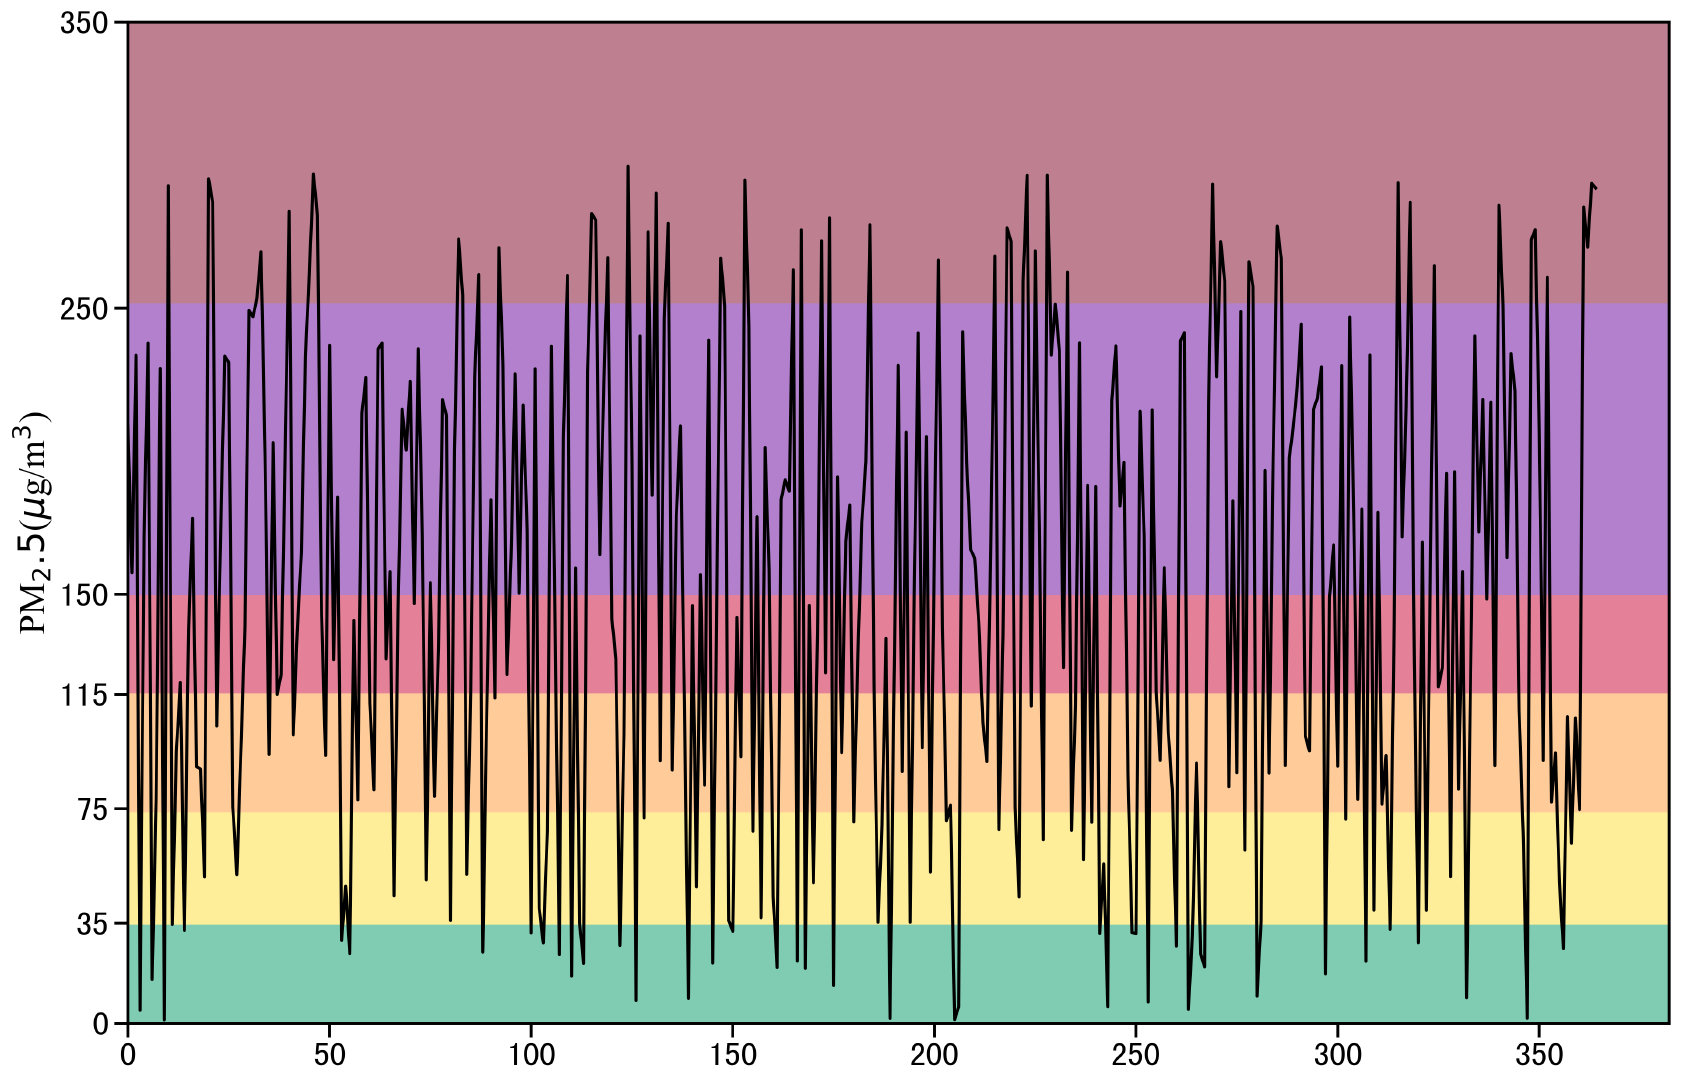
s = np.repeat(np.arange(350), 365).reshape((350, 365))
fig, ax = plt.subplots(figsize=(18, 12))
xlims = mdates.date2num(data.index.values) # 转换datetime为timestamp
## imshow 默认 aspect 为 equal,应设置为 auto 才能使上述 figsize 参数生效
ax.imshow(s, cmap=cmap_pm, alpha=0.5, norm=norm, aspect='auto',
extent=[xlims[0], xlims[-1], levels[-1], levels[0]])
ax.invert_yaxis() # 反转 y 轴
ax.xaxis_date() # 设置x轴刻度格式
# 不能使用 plot_date,因为imshow 暂时不支持 datetime axes
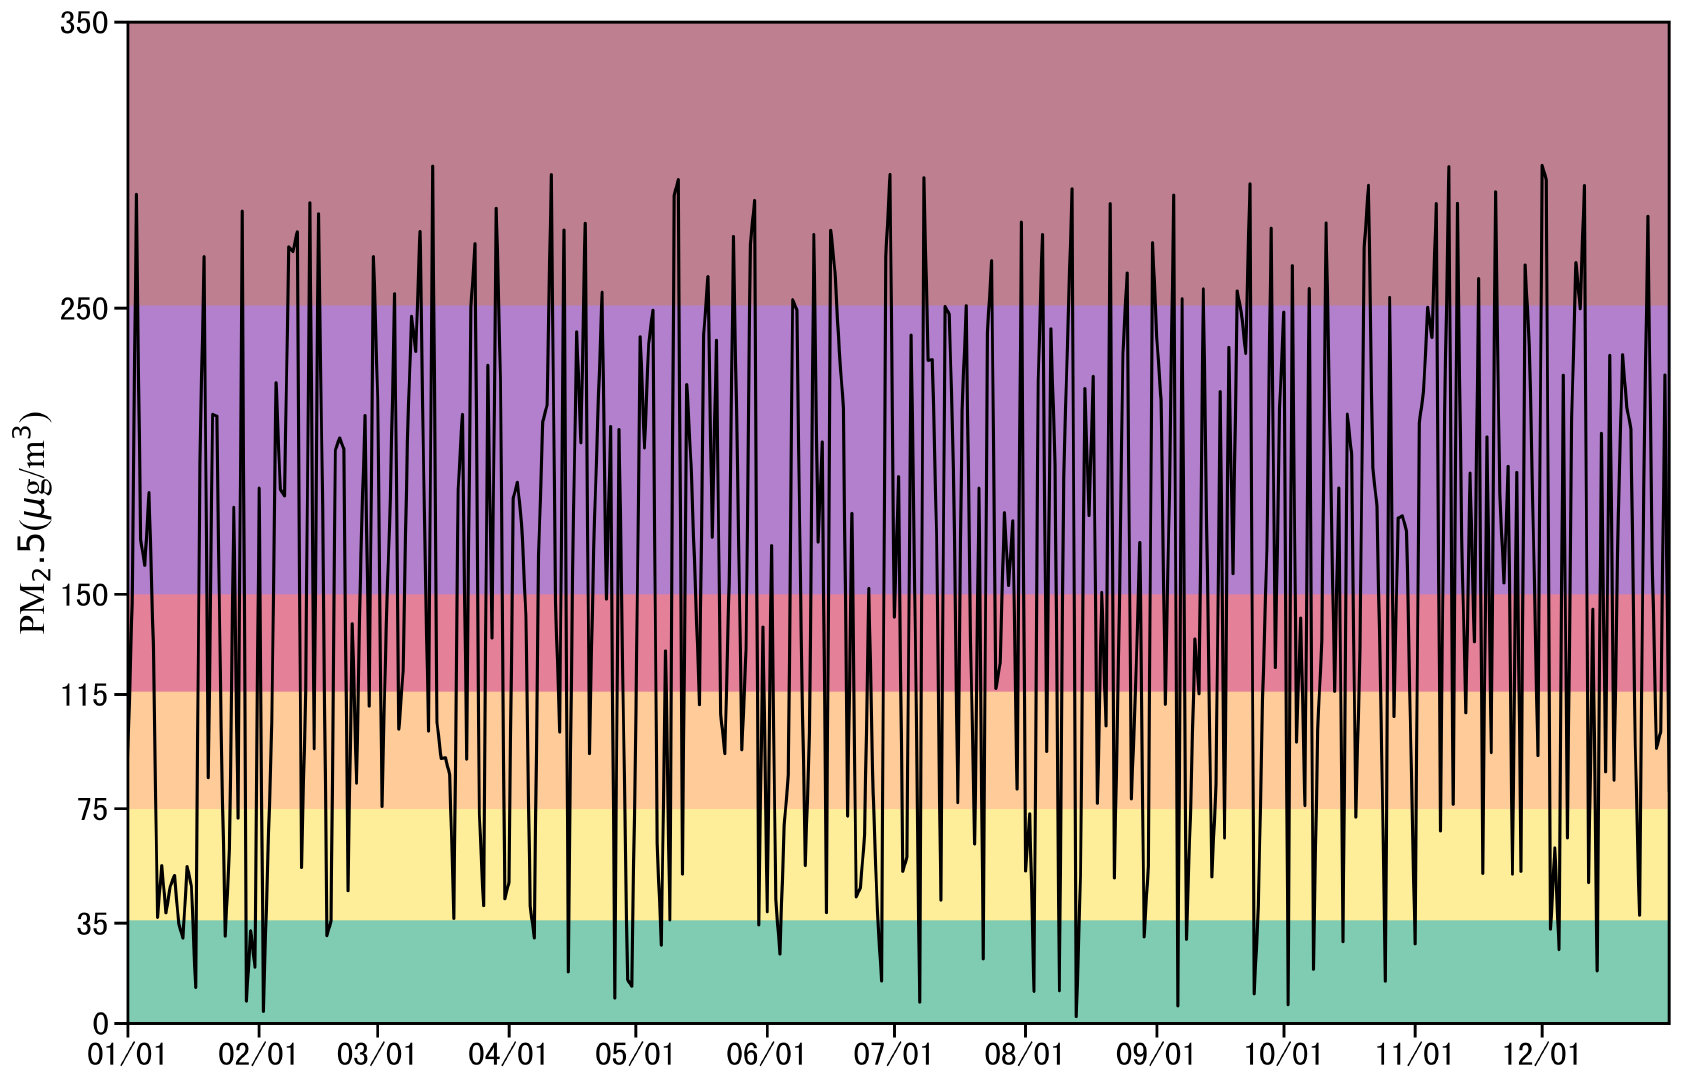
ax.plot(data['pm2.5'], color='k', linewidth=2)
date_format = mdates.DateFormatter('%m/%d')
ax.xaxis.set_major_formatter(date_format)
ax.set_yticks(levels)
_ = ax.set_ylabel('PM$_2.5$($\mu$g/m$^3$)', fontdict=dict(fontfamily='Times New Roman'))
|